Showing posts with label Internet Mapping. Show all posts

Saturday, November 3, 2007

Axis Order Confusion: Software, Geodesy & Transformations


Axis Order Confusion


Not simply X, Y, Z or N, E, S, W, but how we interpret them and use them in software, geodesy and navigation - it varies and has led to confusion among many people. This is an overview of the systems, the problem and points out things to take note of.


Over time, since the early days of mathematics, and then moving into software development, GIS and internet mapping, axis play an important role, whether it be in datum transformation or even displaying a map.


Is it X,Y,Z or Z,Y,X?


As we know in mathematics, a coordinate system is a system for assigning n-tuple of numbers or scalars to each point in n-dimensional space.


We are familiar with the following coordinate sytems involved in GIS/Mapping and Geodesy:


  • Cartesian coordinate system, which may be called "rectangular", where for 3D space, it uses three numbers representing some distance

  • Polar coordinate systems

  • Curvilinear coordinates, which are based on an intersection of curves


Delving further into Polar coordinate systems, we see the following subtypes:


  • Circular coordinate systems, which is represented by a point in a plane, by an angle, and a distance from the origin

  • Cylinderical coordinate systems which require a point in space, a distance from an origin an a height

  • Spherical coordinate system, which is represented by two angles and a distance from an origin


In mapping and geodesy, we deal quite often with Spherical coordinate systems and often refer to them as Geographic Coordinate Systems.


Ordered Pairs & Coordinate Systems


In GIS software and mapping software, we have three different perspectives for an Ordered Pair (2-tuple). They are in computer science, mathematics and of course Geographical Coordinate Systems.


Let's take a quick look at how these distinct perspectives see the their world:


In computer science and computer graphics, the axis order is (X,Y), where unsigned values increase to the bottom and to the right.


Mathematics sees this world differently for the same axis order (X,Y), where we have signed values increase to the right and upwards.


In the world, where we are most involved, Geographical Coordinate Systems, the axis order varies, sometimes being (X,Y) or (Y,X). The signed values increase upwards and to the right, based on a spheroid, hence we have -180, -90, 180, and 90.


Rotation Confusion as Well - Which Sign is positive?


There are 2 different conventions in use in the survey and mapping industry for defining rotations.


This too has led to considerable confusion in the GIS and mapping world.


Both are valid when used properly.


The two conventions can be referred to as:


1) Position Vector rotation (Commonly referred to as the Busra-Wolfe)


2) Coordinate Frame rotation


This essentially comes down to the left-handed vs. right-handed rotations (see image above) for the various transforms.

But what does this mean with left vs. right? Well, this is one way of determining orientation of axes and direction of rotations.

  • Thumb = Positive X
  • Index up = Positive Y
  • Middle out = Positive Z


Clifford's Point of View

Clifford Mugnier of LSU, whom I met when I lived in Houston, gives a good explanation and way of handling rotations and coordinate systems. His reply can be found here.

My quote follows:

"Probably the best way to document a rotation method is:

use the accepted terms "coordinate frame" and "position vector".

These terms are also used in other disciplines like kinematics (robotics).

But there are more difficulties.One datum transformation method is laid down in the ISO 19111 standard.

This is an approximated 7-parameter Helmert transformation with position vectorrotation. See also ISO/IEC 18026 - Annex B.

PROJ uses about the same method, only the scaling method differs. PROJ does a scalar multiplication, ISO a matrix multiplication.

With the commonly used parameter ranges, the differences between the scaling methods are less than microns, so not important.

As far as I know, the Bursa-Wolfe transform is an approximation to theHelmert transform. The Helmert transform has sines and cosines in therotation matrices, whereas Bursa-Wolfe (and ISO 19111) use the angles themselves (since sin(a) ~ a, sin(a)*sin(b) ~ 0, and cos(a) ~ 1 for small angles).

If you read section B.6 of ISO/IEC 18026, then you'll notice that aBursa-Wolfe transform can be done with a position vector rotation model OR with a coordinate frame rotation model.

Just what one likes the best; be sure to use the correct sign of the rotation angles.

Therefore:

Bursa-Wolfe is NOT equivalent with this or that rotation model.

A well known expert repeatedly states that the Australians use the same datum transform rotation model as the Americans.

This is NOT true!

The order of the rotations differs (XYZ vs. ZYX).

See the Australian GDATechnical Manual.

By the way, if the rotations are approximated, then the order is not important.

Again, the differences in rotation order for real life numbers are literally microscopic."

He clearly points out, and I agree, that it is "silly to refer to a datum transformation method as an American, Australian, European, whatever regional model. If you want to document the way for instance an application transforms,givethe complete formulae, not just an ill-defined name. Why not referring to the EPSG coordinate transformation method numbers? These clearly define the most used datum transformation methods and projection methods."

A simple solution to a complex problem of rotations.

The key is to document and document and be sure to specify what is being done, what axis are being used and let your users know. Do not assume, ask questions, and your life will be easier when dealing with coordinate sytems and rotations.

Or even simplier, as Clifford points out, refer to the coordinate transformation method numbers referenced in the EPSG data and data model for defined coordinate sytems.

Thursday, November 1, 2007

Quarter Degree Grid Cells: Another way of Mapping Africa


Recently, Ragnvald Larsen of the Norwegian University of Science and Technology (NTNU) in Trondheim released some news to the Spatial Data Infrastructure for Africa (SDI-Africa) mailing list.

He has been working on project about creating Quarter Degree Grid Cells for mapping purposes for the African countries on a national level.

But what are Quarter Degree Grid Cells?

Quarter Degree Grid Cells (QDGC) are a way of dividing longitude and latitude degree square cells into smaller squares, forming in effect a system of geocodes. This is similar to the NTS system in Canada (for mapping the Northern areas of Canada) and to the way the North Sea is mapped when determining leases by the various countries involved (Norway, Denmark, UK, Germany, the Netherlands). An example of how the North Sea is subdivided by country follows:

The respective sectors are divided by median lines agreed in the late 1960s.

In the United Kingdom, the UKCS (United Kingdom Continental Shelf) is divided into quadrants of 1 degree latitude and one degree longitude. Each quadrant is divided into 30 blocks measuring 10 minutes of latitude and 12 minutes of longitude.

Norway has a similar model and is divided into quadrants of 1 degree by 1 degree. Norwegian licence blocks are larger than British blocks, being 15 minutes of latitude by 20 minutes of longitude (12 blocks in a quad).

In Denmark, the Danish sector of the North Sea is divided into 1 degree by 1 degree quadrants, and their blocks are 10 minutes latitude by 15 minutes longitude.

Germany and the Netherlands share a quadrant and block grid - quadrants are given letters rather than numbers. The blocks are 10 minutes latitude by 20 minutes longitude. The Dutch sector is located in the Southern Gas Basin and shares a grid pattern with Germany

So the theory of using grid squares has been around for quite some time.

Almost Equal Areas

QDGC represents a way of making (almost) equal area squares covering a specific area to represent specific qualities of the area covered. The squares themselves are based on the degree squares covering earth.

We know that around the equator there are 360 longitudal lines lines. For latitude, i.e. from the north to the south pole we have 180 latitudal lines. Multiplying we determine that this gives 64800 segments or tiles that can cover earth. The form of the squares becomes more rectangular the further north or south we move. At the poles they are not square or even rectangular at all, but end up in elongated triangles.

Each degree square is designated by a full reference to the main degree square.

An Example using Tanzania

Taking from the project web-site, I'll use their example, with regards to Tanzania.

S01E010 is a reference to a square in Tanzania. S means the square is south of equator, and E means it is East of the zero meridian.

The numbers refer to longitudal and latitudal degree.

A square with no sublevel reference is also called QDGC level 0.

This is square based on a full degree longitude by a full degree latitude. The QDGC level 0 squares are themselves divided into four.

A grid at this level is shown as:

AB
CD


Smaller squares are determined by dividing the above squares into 4 again.

So if we divide S01E010 by four again, the new grid would be S01E010AD.

The number of squares for each QDGC level can be calculated using the following formula:

number of squares = (2^d)^2 where d is QDGC level

Putting all the above theory into place, there is code out there that will allow you to compute a Quarter Degree Grid Cell, please follow the link here.

Project Information

For more information on this project and the work done by Ragnvald Larsen, please take a look at QDGC.

The attached image shows QDGC being used for mappings of the fires in Africa in the year 2000.

Monday, October 22, 2007

The Geoid - An Equipotential Description with Gravity


The Geoid is a surface that is not often talked about on blogs or mentioned on the web - so this may be a first.


The Geoid surface is irregular, unlike reference ellipsoids (such as Clarke 1866, Bessel, Hayford, etc.) which have been used to approximate the shape of the physical Earth at a local point. The geoid is considerably smoother than Earth's physical surface.


In looking for a good description that makes sense to many people, I stumbled upon this one on Wikipedia:


"In geodetic surveying, the computation of the geodetic coordinates of points is commonly performed on a reference ellipsoid closely approximating the size and shape of the Earth in the area of the survey. The actual measurements made on the surface of the Earth with certain instruments are however referred to the geoid. The ellipsoid is a mathematically defined regular surface with specific dimensions. The geoid, on the other hand, coincides with that surface to which the oceans would conform over the entire Earth if free to adjust to the combined effect of the Earth's mass attraction (gravitation) and the centrifugal force of the Earth's rotation. As a result of the uneven distribution of the Earth's mass, the geoidal surface is irregular and, since the ellipsoid is a regular surface, the separations between the two, referred to as geoid undulations, geoid heights, or geoid separations, will be irregular as well."


and further it states:


"The geoid is a surface along which the gravity potential is everywhere equal and to which the direction of gravity is always perpendicular. The latter is particularly important because optical instruments containing levelling devices are commonly used to make geodetic measurements. When properly adjusted, the vertical axis of the instrument coincides with the direction of gravity and is, therefore, perpendicular to the geoid. The angle between the plumb line which is perpendicular to the geoid (sometimes called "the vertical") and the perpendicular to the ellipsoid (sometimes called "the ellipsoidal normal") is defined as the deflection of the vertical. It has two components: an east-west and a north-south component."


The reference surface for heights is traditionally taken as Mean Sea Level (MSL).


The geoid, as described above, is a surface of equal gravity potential which closely approximates mean sea level.


With GPS becoming more and more relevant in our daily lives, what is the height measurement we get?
The heights derived from GPS are relative to the GPS reference ellipsoid (WGS84). The separation between the geoid and an ellipsoid is known as the geoid-ellipsoid separation, or N value.


In a mathematical sense, we have the following then:


H = h - N


where H = Orthometric Height


h = Ellipsoidal Height (for example, the height above the ellipsoid WGS84)


N = Geoid-Ellipsoid Height (this is also called the Geoid Undulation)


Note that with N, that if the geoid is above the ellipsoid, N is positive. If the geoid is below the ellipsoid, N is negative.


How does mass effect the geoid and the ellipsoid?


Where a mass deficiency exists, the geoid will dip below the mean ellipsoid and where a mass surplus exists, the geoid will rise above the mean ellipsoid.


Where are the largest undulations?


Well, the largest undulations known, with the minimum in the Indian Ocean at a value of N = -100 metres and the maximum in the northern part of the Atlantic Ocean with N = +70 metres.


So how do we describe the shape and size of the Earth?


There are three surfaces to be considered:


  • The topography - the physical surface of the earth.


  • The Geoid - the level surface (also a physical reality).


  • The Ellipsoid - the mathematical surface for computations.


Mean Sea Level (MSL) points, an approximation to the geoid, and can be used as reference surfaces for height measurements (i.e. orthometric heights).


Ellipsoidal heights (such as those derived by GPS) have to be adjusted before they can be compared to the orthometric heights given on topographic maps.


The deviation between the geoid and an reference ellipsoid is called Geoid undulation (N). Geoid undulations can be used to adjust the ellipsoidal heights (H = h +/- N).


This is an introduction to the Geoid and the science of Geodesy. It hopefully clears up some questions about this surface.

I'll explain in more detail some of the formulations of the Geoid and how geodesists over time have tried to model it and some of the efforts being conducted presently to come up with a global gravity model to aid in height determination at a later date.

There are some very interesting projects going on in Africa, South America, and Canada.


Tuesday, October 9, 2007

Shapefiles and PRJ - Tying them together

ESRI has developed a de-facto standard for Shapefiles, but sometimes we as users' of Shapefiles forget something, a Shapefile is actually a minimum of three files.

The three mandatory/required files are:
  • .shp - the file that stores the feature geometry.
  • .shx - the file that stores the index of the feature geometry.
  • .dbf - the dBASE file that stores the attribute information of features.

A recent thread on the GDAL Mailing List led to the first link about Shapefiles. The key to the thread was a discussion about where Projections are stored in the Shapefile definition. As it can be seen, there is no location in the required files for projections.

Therefore ESRI adopted a new file type (PRJ) with the extension .prj.

So how are projections defined in this file?

As we know coordinate systems in terms of mapping can either geographic (longitude, latitude) or projected (X, Y). In the PRJ definition, the coordinate system is composed of several objects, with every object having a keyword in uppercase. Objects can be composed of other objects. ESRI calls the string in this file a Projection Engine (PE). The Sole purpose of the Projection Engine is to store the metadata for a coordinate system in a string, or in a .prj file. This string, which ESRI also calls a PE (not for Physical Education!) string, must be continuous and not broken.

Now the scary part: You can define your own units, datums, and spheroids!

An example, taken from the ESRI website, shows how we can define in .prj file a projected or geographic definition.

As we know projected coordinate systems (of which maps are) are based upon a geographic coordinate system (latitude, longitude), so the in their sample file, a projected coordinate system first is defined.

For example, UTM zone 10N on the NAD83 datum is defined as

PROJCS["NAD_1983_UTM_Zone_10N",
,
PROJECTION["Transverse_Mercator"],
PARAMETER["False_Easting",500000.0],
PARAMETER["False_Northing",0.0],
PARAMETER["Central_Meridian",-123.0],
PARAMETER["Scale_Factor",0.9996],
PARAMETER["Latitude_of_Origin",0.0],
UNIT["Meter",1.0]]

The geographic coordinate system name is followed by the datum, the prime meridian, and the angular unit of measure.

The geographic coordinate system string for UTM zone 10N on NAD 1983 is:

GEOGCS["GCS_North_American_1983",
DATUM["D_North_American_1983",
SPHEROID["GRS_1980",6378137,298.257222101]],
PRIMEM["Greenwich",0],
UNIT["Degree",0.0174532925199433]]

The full string representation of NAD 1983 UTM zone 10N is:

PROJCS["NAD_1983_UTM_Zone_10N",
GEOGCS["GCS_North_American_1983",
DATUM["D_North_American_1983",
SPHEROID["GRS_1980",6378137,298.257222101]],
PRIMEM["Greenwich",0],
UNIT["Degree",0.0174532925199433]],
PROJECTION["Transverse_Mercator"],
PARAMETER["False_Easting",500000.0],
PARAMETER["False_Northing",0.0],
PARAMETER["Central_Meridian",-123.0],
PARAMETER["Scale_Factor",0.9996],
PARAMETER["Latitude_of_Origin",0.0],
UNIT["Meter",1.0]]

As I stated earlier, you can define your own to use the predefined names for map projection and parameter object's.

I hope the above information aids in your understanding of Shapefiles and how projections and coordinate systems are defined.

My best advice for dealing with PRJ files; copy one that you already have and use it as a base, then modify the parameters as you need.

Good luck and have fun!

Monday, October 8, 2007

GeoTunis 2007 - November 15-17, 2007 - Tunis Science City


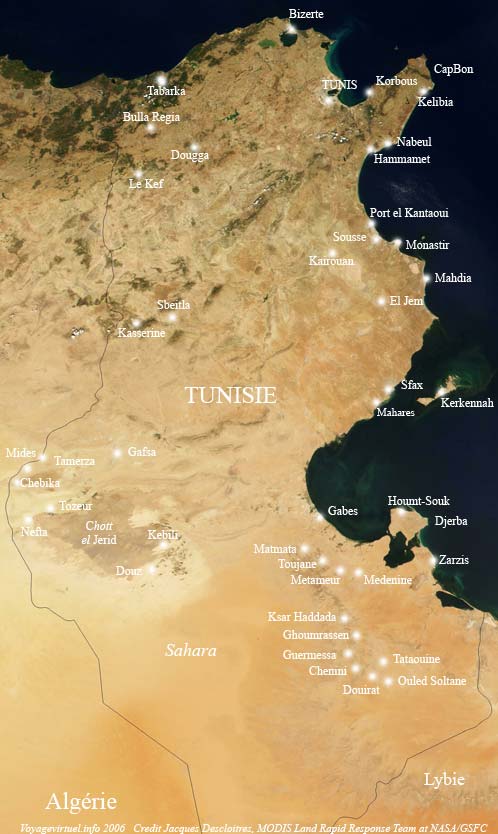
GeoTunis is occurring between 15th and 17th, November 2007 at the Tunis Science City in Tunisia.


As the website states: 'The task being an equal knowledge development and a stronger control of the digital information and telecommunications technologies with the purpose to decrease the digital gap between peoples. This symposium makes real the resolutions taken during the first national conference on map production "Geotunis 2006" and takes place in the same time with the International group world day celebration on the geographic information systems.'

OSGeo is hoping to be there as well, and information on OSGeo's participation can be found at here. This group is looking at promoting OSGeo and the Open Source Philosophy as it applies to Geospatial. They are also hoping to establish a stronger Francophone/French Speaking chapter that will include many French speaking nations.

I worked in Tunisia several years back with Schlumberger, involved with the Finder Data Management software and Tunisia's State Owned Oil Company - ETAP.

It is a beautiful country with great people and great food. The "Thé à la Menthe" and the "Chorba" are incredible.

With any luck, I'll make it to GeoTunis and be able to meet some new and old friends!


Saturday, October 6, 2007

MapBender 2.4.3 Released & Online Training - An Orchestra of Data & Maps


While at FOSS4G2007 here in Victoria, I had my first introduction to MapBender and Arnulf Christi. My introduction was through a workshop entitled "Mapbender, Orchestrating the Geodata Concert". It was indeed a concert. Through the design of the software, you can pull together an instrumental or a ballad of data and imagery with ease.


Looking for a very good description of this orchestra, led me to their website, where I quote "Mapbender is the software and portal site for geodata management of OGC OWS architectures. The software provides web technology for managing spatial data services implemented in PHP, JavaScript and XML. It provides a data model and interfaces for displaying, navigating and querying OGC compliant map services. The Mapbender framework furthermore provides authentication and authorization services, OWS proxy functionality, management interfaces for user, group and service administration in WebGIS projects."

With Arnulf's planning and a strong understanding of MapBender, the workshop was a success, as we were Guinea Pigs for their online course. I do recommend to everyone new to MapBender.
I'm still finding out what software is out there in the OSGeo world, but MapBender ranks very high on my list of tools I want to keep in my toolbox.
The Press Release found on OSGeo states that minor changes were made, bugs fixes completed, a move to Trac (to keep track of changes), and Wiki to keep the project Human(e and) Readable. This is a key point, because sometimes reading code can be very inhumane (I know from experience!).
A full fledge training course (Online, I must add again!), can be found here.
I strongly encourage everyone to look at this project and delve into the training course, then look at adding MapBender to your list of tools that will allow you to build your Orchestra of Data & Maps from Services Worldwide.

Tuesday, October 2, 2007

EPSG Definitions and Searches Online


The EPSG has been around for what seems forever and the codes and definitions have made their way into Open Source GeoSpatial and Commercial software.


One difficulty has been the way many packages have implemented the database. Schlumberger converted the tables into CSV files for lookup with their initial implementation, then they adopted Mentor Software's approach and Mentor's C++ libraries. Different people see the data outside of the traditional MS Access approach and most often turn to some database that is not owned by Bill Gates! I think Larry Ellison was happy about this. EPSG realising this, then started releasing the data and data model in many different RDBMS formats (SQL scripts to create the tables and populate the database).


They released Version 6.14 on 2 September 2007.


There are various software providers and oil service companies that have taken the SQL and have produced web-sites that allow users to query the EPSG dataset in many different ways.


Three very useful sites are:


Developed by Petrosys for the oil and gas industry.


Developed by Howard Butler and Christopher Schmidt. They had a very simple aim: "hopes assist others in their understanding, recording, and usage of spatial reference systems". And they are succeeding. The site provides various formats for the codes to implement into web-mapping and software development.


This EPSG viewer was developed by Concept Systems Ltd., division of ION Geophysical Corporation. ION was previously known as Input/Output (I/O) and on September 21, 2007 they changed their name to better represent their services.


Have fun with these sites, and if you have any questions about the EPSG database, do not hesitate to contact me at the Terra ETL Website, under About Us.


Friday, September 14, 2007

MapGuide Open Source 1.2 Released & DM Solutions Fusion


MapGuide Open Source 1.2.0 has been released.

With this release of MapGuide Open Source, there have been enhancements that include:

1) Support for Unmanaged Data Sources
2) Cartographic Enhancements - Phase I

This includes the ability to use new symbols for Points and Labeling Linear Features (e.g. Highway Shields)


3) Feature Join Enhancements
4) Support coordinate system overrides on feature sources

More details can be found here.

Point 4 is interesting, as in MapGuide Open Source, there is within a feature source, an optional tag called SupplementalSpatialContextInfo. If an entry exists for a given Spatial Context, then the specified coordinate system override will be used. The coordinate system override will be given preference over the coordinate system defined in the data.

In the previous version, the SupplementalSpatialContextInfo was used only for data containing spatial contexts with undefined coordinate systems (I'll talk more about co-ordinate systems and map projections in future blogs). This SupplementalSpatialContextInfo would allow a coordinate system to be specified for a given spatial context. Essentially, the new SupplementalSpatialContextInfo can now be used to override coordinate systems for all spatial contexts in a feature source -- regardless of whether it contains a coordinate system or not.

Why did this modification come about?

Sometimes a feature source geometry may contain an incorrect coordinate system or does not have a coordinate system defined. What can be now? The above solution provides a convenient way to change the coordinate system without having to change the data of the feature source.
MapGuide Open Source handles spatial data with a specified coordinate system and with this modification it allows for the specification of a coordinate system override thereby letting the developer use data that in the past you may not have been able to use.

Symbols and Labels

Many GIS and Mapping applications are in need of very sophisticated symbolization. In the oil and gas industry, we see so many symbols and sometimes one symbol may have more than one definition (dry well, dry & abandoned, etc.).

In many parts of the world, countries published maps must adhere to high standards that are often even written into law. Amazingly though, sometimes even these maps are missing some of most standard information, such as Datum and Map Projection. The Cartographic Enhancements - Phase I introduces a high quality symbolization engine for MapGuide Open Source and allows for point symbols to be used as labels. This is especially pratical in the E&P industry.

Leaders Collaborating - MapGuide Open Source Fusion

As it can be seen Autodesk and the Open Source community are working together successfully in producing a user-friendly, practical, and powerful web-mapping tool.

DM Solutions and Autodesk have been working together on MapGuide Open Source Fusion. Dave McIlhagga and the DM Solutions group provide a very good description of Fusion here.

Take a look at how collaboration between these two companies have helped to move MapGuide ahead. Fusion is also available for UMN MapServer.

Open Source - A new software development paradigm?

Open Source development has been around for awhile, but it looks like it is gaining more momentum and with Autodesk's participation, we are seeing leaders in CAD and GIS realizing the advantages of working collaboratively with others to develop products that can be used and accepted by others.

I'll be talking more about Open Source Software development and some of the business models used and the many advantages of using Open Source in many different industries.

Friday, August 24, 2007

GDAL2Tiles - Summer of Code - EPSG:4326


Being involved in the Open Source world as it applies to Geospatial is interesting.


Google does almost every year, a Summer of Code, and OSGeo was involved in this as well. More information can be found on the Wiki about this years projects.


Tiling and speed have always been issues with Internet Mapping - especially with Raster Images.

Just recently Klokan Petr Pridal described his Summer of Code project as being able "to allow easy publishing of raster maps on the Internet. Your raster file (like TIFF/GeoTIFF, MrSID, ECW, JPEG2000, JPEG, PNG) is converted into a directory structure of small tiles (TMS compatible), which you can just copy to the webserver. Simple webpages with viewers based on Google Maps and OpenLayers are generated as well - so anybody can comfortably explore your maps on-line and you do not need to install or configure any special software (like mapserver) and the map displays very fast in the webbrowser. "


Through Open Source we are seeing innovation in the way software is being developed and the speed of take-up and understanding by developers worldwide. Tools, such as the one's developed by Klokan will soon be on internet maps worldwide, using libraries that have being developed by Frank Warmerdam (FWTools, GDAL) to make mapping easier.


Of course, there are always co-ordinate system problems involved and some restrictions. Currently the software (if using Google) is restricted to EPSG:4326 (Good ol'WGS84!). There is one line that scares us Surveyors - "World files and embeded georeference is used during tile generation, but you can publish a picture without proper georeference too".


No Georeference means - where are we? Be careful out there. Co-ordinates are always important in any mapping application. It is always important to know your:


1) Datum


2) Map Projection


3) Ellipsoid


as a very bare minimum. Depending on the Map Projection used, then you always have to consider the False Easting, False Northing, Central Meridians, Latitudes, etc..


As the technology increases and becomes faster and easier, we can tend to make mistakes easily and make too many assumptions about the data. Not all data is EPSG:4326. Remember, maps are only as good as the people who produce and understand them. When you have people reading and relying on your maps, especially when pulling data (for eg. via WFS), there may be different co-ordinate systems - hence roads may move, lakes may be on cities, etc., etc..


As the blog posting several days back pointed out, boundaries are important and the idea of Redrawing the Map was discussed. We'll see what happens in resolving this political dispute, but again the accuracy of the data and the maps produced will be important.


Now, for an excellent example of GDAL2Tiles - Summer of Code, take a look at the beautiful country of the Czech Republic and see some tiling and speed that can put some commercial software to shame.


An example of tiling using Open Layers is the city of Moscow.


See if you can find the Kremlin and Red Square.


Keep on watching this space and I'll bring more news about Open Source for GeoSpatial and someday soon will be producing some samples using Oil and Gas, Mining and Forestry Data.


It is a whole new world out there and geomatics is changing rapidly.