Monday, October 29, 2007

ETL: Fundamental to Spatial Analysis and Sharing of Data

Extract, Transform, and Load

ETL or Extract, Transform, and Load is a process in Data Warehousing. Data Warehouses are all around us - whether we are querying the Yellow Pages on-line to geo-coding our datasets, there is most often a database or data warehouse behind the scenes.

But how we get data into the warehouse, is called ETL.

This is a short introduction to ETL as it is an important part of data warehousing. I also cover a little about Spatial ETL.

Extract

Extract is where we begin this story. Essentially, in this step, we extract the data from source systems. A source system is where the data originates. It may be a well database, an address database, a MSExcel CSV file or almost anything you can think of.

A data warehouse ends up consolidating the data from different source systems. Each separate source system (in many cases) use a different data organization or format. Common data source formats are relational databases and flat files.

Transform

As our story continues, we run into the transform stage. In this chapter, we want to apply a series of rules or functions to the extracted data from the source to derive the data to be loaded to the end target.

If we are fortunate in having clean data (this rarely happens!) the data source will require very little or even no manipulation of the data. The most common scenario is that one or more of the following transformations need to be done to meet the business and technical needs of the end users.

For example, some of the transformations that may occur are (taken from Wikipedia - a good listing of transformations):

  • Selecting only certain columns to load
  • Translating coded values (e.g., if the source system stores 1 for male and 2 for female, but the warehouse stores M for male and F for female), this is called automated data cleansing; no manual cleansing occurs during ETL
  • Encoding free-form values (e.g., mapping "Male" and "1" and "Mr" into M)
  • Deriving a new calculated value (e.g., sale_amount = qty * unit_price)
  • Joining together data from multiple sources (e.g., lookup, merge, etc.)
  • Summarizing multiple rows of data (e.g., total sales for each store, and for each region)
  • Generating surrogate key values
  • Transposing or pivoting (turning multiple columns into multiple rows or vice versa)
  • Splitting a column into multiple columns (e.g., putting a comma-separated list specified as a string in one column as individual values in different columns)
  • Applying any form of simple or complex data validation; if failed, a full, partial or no rejection of the data, and thus no, partial or all the data is handed over to the next step, depending on the rule design and exception handling.

Load

After the data has been transformed, cleansed, it is now loaded into the data warehouse.

Spatial ETL

When we apply the above principles to spatial data, we call it Spatial ETL.

As we know, spatial data can suffer tremendously in accuracy, data formats, projections, datum's, etc.

With the advent of WFS and WMS and other Web Services and definitions - knowing how accurate and clean our data is is important - especially since in Web Services we are sharing data between systems.

A common method in the Well-known text (WKT). WKT is a text markup language for representing vector geometry objects on a map. It also relates to spatial reference systems of spatial objects and of the transformations between spatial reference systems. A binary equivalent, known as well-known binary (WKB) is used to transfer and store the same information on databases, such as PostGIS. The formats are regulated by the Open Geospatial Consortium (OGC) and described in their Simple Feature Access and Coordinate Transformation Service specifications.

Frank Warmerdam, the creator and maintainer of the PRO.4 and GDAL libraries of which I've talked about before covers quite well, WKT implementations and things to be aware of in several GIS products (some of the information is out of date - most users are now using Arc 9 and above).

Quoting below (from here):

  • Oracle Spatial (WKT is used internall in MDSYS.WKT, loosely SFSQL based)
  • ESRI - The Arc8 system's projection engine uses a roughly simple features compatible description for projections. I believe ESRI provided the WKT definition for the simple features spec.
  • Cadcorp - Has the ability to read and write CT 1.0 style WKT. Cadcorp wrote the CT spec.
  • OGR/GDAL - reads/writes WKT as it's internal coordinate system description format. Attempts to support old and new forms as well as forms from ESRI.
  • FME - Includes WKT read/write capabilities built on OGR.
  • MapGuide - Uses WKT in the SDP data access API. Roughly SF compliant.
  • PostGIS - Keeps WKT in the spatial_ref_sys table, but it is up to clients to translate to
  • PROJ.4 format for actual use. I believe the spatial_ref_sys table is populated using OGR generated translations.

ETL and Spatial ETL - I'll cover more of how data warehousing and GIS and internet mapping can be tied together at a later date.

If you are really interested, take a look at the MapBender project mentioned in earlier posts. It ties together many of the concepts of ETL and data sharing quite well.

If you have ideas for Blog posts that relate to GIS, Datum's, Map Projections, Oracle, Data Warehousing, let me know. Some ideas for future blogs are:

  • The African Geoid Project
  • Map Projections of the Middle East
  • Determining Mean Sea Level
  • NTv2 files and how to create them

Let me know. Contact me via e-mail.

Friday, October 26, 2007

Joint Industry Project: Geospatial Integrity of Geoscience Software


Devon Energy, Shell, and ExxonMobil and several other major oil companies have started a Joint Industry Project (JIP) entitled "Geospatial Integrity of Geoscience Software".


This project is being financed by the oil majors and is being undertaken with the support and co-operation of the International Association of Oil and Gas Producers (OGP).


As professionals involved mapping, software development, positioning, often the co-ordinate reference systems in the code are taken for granted. This happens in the oil industry in geoscience applications and interpretation packages.


In the past, software provided defaults (such as Clarke 1866 or NAD27 - as it was software developed in North America), but with the movement into global geodetic reference systems (such as WGS84), and many local datum's still being used, software may or may not be upgraded (for various reasons) or further modified (feel that it is working fine), etc., etc., there is the distinct possibility and fact that mistakes have been made due to software errors. The errors may have occurred because of the following reasons:


  • improperly coded or cartographic algorithms

  • wrong values for embedded geodetic parameters

  • poor presentation of user input requirements by software applications

  • incorrect defaults settings (as mentioned above)

  • software processes not working as specified (take a look at the Robinson projection discussion and cs2cs and the various work-arounds to account for a spherical representation)

  • confusing or imprecise terminology (take co-ordinate reference frames and datum transformations for example)

  • lack of error trapping for user errors

  • lack of an audit trail

  • inadequate metadata

  • inadequate training and documentation for users and of users

There are three main objectives of this Joint Industry Project, and they are:


  • To transform the management of geospatial data in geoscience software applications to benefit JIP members and improve products and competencies

  • To develop and disseminate best practice tools for current software applications and future software development

  • To create a sustainable improvement process in geoscience software applications based on sound geospatial management

By the end of 2007, the JIP has already begun to take a look at Blue Marble's GeoGraphic Calculator. This application and libraries is used in commercial code (such as Oracle) and many oil and gas companies use it on a daily basis.


An example of a possible wrong vertical co-ordinate system happened November, 1999 to Chevron. The article can be found here. I've also included it below:


Chevron Mulls Options After Platform Sinks, Friday, November 12, 1999


Chevron Corp. is assessing the impact on the development timetable of its North Nemba oilfield off the Angola coast after the sinking of the production platform on route from South Korea. The $175 million dollar structure was being shipped by the vessel Mighty Servant 2 early last week when it capsized near the Indonesian island of Singkep with the loss of four crew members. The so-called topside production platform is 230 ft. long, 105 ft. wide, 150 ft. tall and took 24 months to design and build. The vessel was enroute from the South Korean port of Okpo to Angola, having fueled in Singapore, when it began taking on water and sank. Chevron spokesman Fred Gorrell said the company was fully covered by insurance to replace the platform. The vessel was lying in 35 m of water with about 5 m sticking above the surface so recovery was still being assessed. Gorrell pointed out that even if it needed to be rebuilt it would not take as long as the original because design and engineering work was already done. The North Nemba field in the prodigious Block O offshore Angola was due to come into production in the first quarter of 2000. Block O, in which Chevron has a 39 percent interest, produced 510,000 bpd in 1998. Gorrell said he wasn't sure how much North Nemba was due to add to this. Chevron owns 39.2 percent of North Nemba, while the state Angola National Oil Co. owns 41 percent, with Italy's Agip owning 9.8 percent and France's Elf Aquitaine with 10 percent.


Co-ordinates, the software we use, whether in mapping or geoscience software plays a role in many of our decisions.


This Joint Industry Project is a good start and the people involved are knowledgeable in the field (many I've worked with when I was in Houston) and through this project we can hopefully know at the end, that the software we are using is providing accurate information and maintains geospatial integrity.


More details can be found at this website.

Thursday, October 25, 2007

Molodensky: A Short History of Man's Contribution to Geodesy


As internet mapping becomes more and more prevelant and GPS is being used more we keep on hearing about the Molodensky Transformation, but who was Molodensky?
A Short History
Mikhail Sergeevich Molodenksy (1909 - 1991) was a promiennt geodesist and geophysicists who many consider a reformer in the theory of the figure of the Earth and the study of the Earth's rotation and oscillations.
He was born on June 15, 1909, in Epiphan, a small town in the Russian province of Tula. He did his initial studies at the Astronomic Department of the Mechanics and Mathematics Faculty of Moscow State University.
He was later invited by F. N. Krasovsky (there is an ellipsoid that bears this geodesist's name - more on a later blog about Russian mapping) to join the staff at the Central Research Institute of Geodesy, Aerophotogrammetry and Cartography (TsNIIGAik). It was here that he worked for over 25 years.
Molodensky's early steps in geodetic research and geodetic surveys date back to 1929 when he did some inital work for the Institute of General Geodetic Surveys (IOGR) and prior to this survey, he was given a proposal from the director of Astronomy - Geodetic Research Institute (AGNII) at State University in Moscow to do geodetic research.
There came a famous decree called the "Soviet of Labor and Defense" (May 6, 1927) which set about the establishment of a general gravimetric survey over the whole country. Lenin was laying out his vision for the country and defining a "Soviet". With this decree, there became an increase in the development of gravimetric surveying throughout the whole country.
Molodensky, who was avidly interested in gravimetry, participated in these surveys with his work at TsNIIGAik. While here and conducting these surveys, a young Molodensky, in 1933, headed up an expedition to the Crimea to perform gravimetric surveys (again under the above decree).
A Rigourous Solution
A year later, in 1934, Molodensky was beginning to make a name for himself by presenting a report at the 7th Baltic Geodetic Commission Conference in Moscow. His topic, which geodesists considered urgent at the time, is the co-swinging influence on double pendulums. Before his presentation, all solutions were seen as impossible because the accuracy of the solutions could not be determined. Molodensky provided a rigourous solution. In turn, this presentation was heard by scientists from Denmark, Finland, Germany, Poland, Sweden, the USSR and the members of the International Association of Geodesy. He essentially turned the world of geodesy upside down concerning astronomic-gravimetric leveling. His final report was published in Helsinki at the 1937 meeting of the Baltic Geodetic Commission.
Molodensky made significant developments to Soviet geodesy and gravimetry, in theory and in practice, especially when developing and applying survey methods combined with the design of gravimetric instruments. In the 1930's the only gravity measuring devices that could be found in the former Soviet Union were those of foreign manufacture. Therefore, the state saw immediately that there was an immediate task facing geodesy in the Soviet Union - the manufacture of gravity measuring instruments. A small batch were initially made, based on the German "Bamberg" instruments and several designs of original instruments had failed. It was not until 1938 that the Soviet Union had developed their own gravity measuring devices.
April, 1943, lead to the appointment of Molodensky as chief of the gravimetric laboratory at TsNIIGAik. He held this post until July 1956 when, against his will, he was appointed director of the Geophysical Institute of the Academy of Sciences (GEOFIAN). At this point he became responsible for the realization of the technical policies related to geodesy in the Soviet Union.
During this time he continued to make significant contributions to geodesy and the state wanted to recognize him for his efforts. In 1946, he was awarded the USSR State Prize, then he recieved the high degree of a Doctor of Technical Sciences and was then elected a member of the USSR Academy of Sciences.
The Geoid and Plumb-Lines
As you may recall in my previous blog, about the geoid, I discussed the "deflection of the vertical", well Molodensky's work played into this realm as well. Molodensky put forward the possibility of using gravimetric survey data for interpolation of plumb-line deflection between astronomic points of astronomic-geodetic networks. The result of this work permitted the integration of isolated sections of astronomic-geodetic networks into the main systems of co-ordinates. This made it therefore possible to map vast areas which had never been surveyed before.
Nowadays a similar process is in progress in Africa and South America and Canada with respects to gravity models which will help in determining Orthometric heights. Through Molodensky, lead to a determination of geoid heights.
In 1957, TsNIIGAik began to change direction in what it saw as important, and focused on solving more complex problems; such as the figure of the Earth, space exploration, defence problems, and the development of triangulation methods for large territories.
Famous Equations
Molodensky, though is more famous for a set of equations, that relate to datum transformation.
As we all know spatial data can have co-ordinates with different underlying ellipsoids or the underlying ellipsoids have different datums. The latter means that, apart from different ellipsoids, the centres or the rotation axes of the ellipsoids do not coincide. To relate these data one may need a so-called datum transformation.
In the early days of satellite surveying, when relationships between datums were not well defined and the data itself was not very precise, it was usual to apply a three parameter dX, dY, dZ shift to the X,Y,Z coordinate set in one datum to derive those in the second datum.
This assumed, generally erroneously, that the axial directions of the two ellipsoids involved were parallel. For localized work in a particular country or territory, the consequent errors introduced by this assumption were small and generally less than the observation accuracy of the data. As we collected more and more information about the shape and form of the Earth, and based on what Molodensky presented, among others, our knowledge and the amount of data that has been built up and as our surveying methods became more and more accurate, it became evident that a three parameter transformation is neither appropriate for world wide use, nor for widespread national use if one is seeking the maximum possible accuracy from the satellite surveying and a single set of transformation parameters.

The simplest transformation to implement involves applying shifts to the three geocentric coordinates. Molodensky developed a transformation which applies the geocentric shifts directly to geographical coordinates. This method assumes that the axes of the source and target systems are parallel to each other.
From a mathematical point of view a datum transformation is possible via 3 dimensional geocentric co-ordinates, thus implying a 3D similarity transformation defined by 7 parameters: 3 shifts, 3 rotations and a scale difference. This transformation is combined with transformations between the geocentric co-ordinates and ellipsoidal latitude and longitude co-ordinates in both datum systems.


The transformation from the latitude and longitude co-ordinates into the geocentric co-ordinates is rather straightforward and turns ellipsoidal latitude , longitude and height into X,Y and Z, using 3 direct equations that contain the ellipsoidal parameters a and e.

The inverse equations are more complicated and require either an iterative calculation of the latitude and ellipsoidal height.
A very good approximation of this datum transformations makes use of the Molodensky and the regression equations, relating directly the ellipsoidal latitude and longitude, and in case of Molodensky also the height, of both datum systems.
Various software uses the formulation put forward by Molodensky, whether used in cs2cs and ESRI software, or even in Oracle, the foundations where laid out by this man who has made significant contribution to our understanding of the shape and form of the Earth.

Monday, October 22, 2007

The Geoid - An Equipotential Description with Gravity


The Geoid is a surface that is not often talked about on blogs or mentioned on the web - so this may be a first.


The Geoid surface is irregular, unlike reference ellipsoids (such as Clarke 1866, Bessel, Hayford, etc.) which have been used to approximate the shape of the physical Earth at a local point. The geoid is considerably smoother than Earth's physical surface.


In looking for a good description that makes sense to many people, I stumbled upon this one on Wikipedia:


"In geodetic surveying, the computation of the geodetic coordinates of points is commonly performed on a reference ellipsoid closely approximating the size and shape of the Earth in the area of the survey. The actual measurements made on the surface of the Earth with certain instruments are however referred to the geoid. The ellipsoid is a mathematically defined regular surface with specific dimensions. The geoid, on the other hand, coincides with that surface to which the oceans would conform over the entire Earth if free to adjust to the combined effect of the Earth's mass attraction (gravitation) and the centrifugal force of the Earth's rotation. As a result of the uneven distribution of the Earth's mass, the geoidal surface is irregular and, since the ellipsoid is a regular surface, the separations between the two, referred to as geoid undulations, geoid heights, or geoid separations, will be irregular as well."


and further it states:


"The geoid is a surface along which the gravity potential is everywhere equal and to which the direction of gravity is always perpendicular. The latter is particularly important because optical instruments containing levelling devices are commonly used to make geodetic measurements. When properly adjusted, the vertical axis of the instrument coincides with the direction of gravity and is, therefore, perpendicular to the geoid. The angle between the plumb line which is perpendicular to the geoid (sometimes called "the vertical") and the perpendicular to the ellipsoid (sometimes called "the ellipsoidal normal") is defined as the deflection of the vertical. It has two components: an east-west and a north-south component."


The reference surface for heights is traditionally taken as Mean Sea Level (MSL).


The geoid, as described above, is a surface of equal gravity potential which closely approximates mean sea level.


With GPS becoming more and more relevant in our daily lives, what is the height measurement we get?
The heights derived from GPS are relative to the GPS reference ellipsoid (WGS84). The separation between the geoid and an ellipsoid is known as the geoid-ellipsoid separation, or N value.


In a mathematical sense, we have the following then:


H = h - N


where H = Orthometric Height


h = Ellipsoidal Height (for example, the height above the ellipsoid WGS84)


N = Geoid-Ellipsoid Height (this is also called the Geoid Undulation)


Note that with N, that if the geoid is above the ellipsoid, N is positive. If the geoid is below the ellipsoid, N is negative.


How does mass effect the geoid and the ellipsoid?


Where a mass deficiency exists, the geoid will dip below the mean ellipsoid and where a mass surplus exists, the geoid will rise above the mean ellipsoid.


Where are the largest undulations?


Well, the largest undulations known, with the minimum in the Indian Ocean at a value of N = -100 metres and the maximum in the northern part of the Atlantic Ocean with N = +70 metres.


So how do we describe the shape and size of the Earth?


There are three surfaces to be considered:


  • The topography - the physical surface of the earth.


  • The Geoid - the level surface (also a physical reality).


  • The Ellipsoid - the mathematical surface for computations.


Mean Sea Level (MSL) points, an approximation to the geoid, and can be used as reference surfaces for height measurements (i.e. orthometric heights).


Ellipsoidal heights (such as those derived by GPS) have to be adjusted before they can be compared to the orthometric heights given on topographic maps.


The deviation between the geoid and an reference ellipsoid is called Geoid undulation (N). Geoid undulations can be used to adjust the ellipsoidal heights (H = h +/- N).


This is an introduction to the Geoid and the science of Geodesy. It hopefully clears up some questions about this surface.

I'll explain in more detail some of the formulations of the Geoid and how geodesists over time have tried to model it and some of the efforts being conducted presently to come up with a global gravity model to aid in height determination at a later date.

There are some very interesting projects going on in Africa, South America, and Canada.


Sunday, October 21, 2007

The Robinson Projection: Not shaped like an Egg


A Pleasing View of the World

The Robinson Projection came into being in 1963 and was introduced by Dr. Arthur H. Robinson.

This projection can be classified as a pseudo-cylindrical projection because of its straight parallels, along each of which the meridians are spaced evenly. The central meridian is also a straight line and all other meridians are curved.

The projection is neither equal-area nor conformal, therefore abandoning both for a compromise for creating what Dr. Robinson felt produced a better overall view of the world. This was the first map projection to be developed for commercial interests. Rand McNally felt that many of the map projections in use did not present the earth as a whole very well. With Mercator the poles were distorted. Robinson, was essentially contracted to develop a map projection that did not maintain angle, direction, or limit distortion, but was sanctioned to produce a map projection that "looked good" for books and atlases.

Remember maps are designed for one of the following 4 reasons:

  • Conformality - the shapes of places are accurate
  • Distance - measured distances are accurate
  • Area/Equivalence - the areas represented on the map are proportional to their area on the earth
  • Direction - angles of direction are portrayed accurately

Dr. Robinson specified the projection to be constructed by referring to a table of cartesian coordinate values at specific intersections of latitude and longitude. The intermediate locations are to be found by interpolation. Dr. Robinson developed the projection through a series of trials, continually iterating till he settled upon the meridian shapes and parallel spacing most pleasing to the eye. In comparison with other Map Projections, they are mainly developed or are formulated as mathematical equations.

Parallels are straight parallel lines, equally spaced between latitudes 38 degrees north and south. Space decreases beyond these limits. The Equator is 0.8487 times as long as the circumference of a sphere of equal area. The central meridian is a straight line 0.5072 as long as the Equator. Other meridians are equally spaced elliptical arcs and concave toward the central meridian. The scale is true along latitudes 38 degrees north and south, constant along any given latitude, and the same for the latitude of opposite sign (Robinson 1974; Snyder and Voxland 1989).

This map projection is also based on a sphere, not an ellipsoid. This is an important point to remember, as the earth is being modelled differently.

What is the true shape of the Earth?

The Earth, in actual fact, is shaped more like an egg, hence, even an ellipsoid is not the best model. In the past, when datum's were more local (such as NAD27, SAD69, Cape Datum, etc.), various ellipsoids were tied to local points on Earth. For NAD27, this was Meades Ranch, Kansas.

But back to the Earth's shape; it is very close to an oblate spheroid — a rounded shape with a bulge around the equator — although the precise shape (the geoid) varies from this by up to 100 metres.


The rotation of the Earth creates the equatorial bulge so that the equatorial diameter is 43 km larger than the pole to pole diameter.

What about height? A whole other story.

Interesting, eh? There are so many different ways to see the Earth. When we look at height systems and describe the geoid, we are describing an equipotential surface. But height is a whole other story, as gravity is involved and it is not as simple as getting the "Zed" or "Zee" measurement from your GPS.

I'll explain height later and how we can determine MSL (and where the "mean" actually comes from).

Thursday, October 18, 2007

Google Maps: Is the Earth a Sphere or Ellipsoid?

Google Maps sees the Earth as a Spheroid, not an Ellipsoid. This came up through a discussion on the PROJ mailing list and I thought it was interesting to point out how Open Source can even handle projected lat/long systems (such as Google Maps) using a very familiar tool called cs2cs.

Christoper Schmidt wrote about it on his blog and also on his blog he points out the EPSG code to use. The magical number for the Google Mercator Projection (of a lat/long grid based on a sphere) is: 900913

Now onto the fun, showing how we can use Open Source to have our data show within a KML project and Google Maps. Quoting from Frank's FAQ, he provides an excellent example, we see the following the use of cs2cs:

"cs2cs +proj=latlong +datum=WGS84 +to +proj=merc +a=6378137 +b=6378137 +lat_ts=0.0 +lon_0=0.0 +x_0=0.0 +y_0=0 +k=1.0 +units=m +no_defs"

Notice the sphere is being used? a=b

Because we are dealing with a sphere, the Y values will be greatly different from those on an ellipsoid (30 to 100 metres or more).

Quoting Frank again:

"In this case, and many other cases using spherical projections, the desired approach is to actually treat the lat/long locations on the sphere as if they were on WGS84 without any adjustments when using them for converting to other coordinate systems. The solution is to "trick" PROJ.4 into applying no change to the lat/long values when going to (and through) WGS84. This can be accomplished by asking PROJ to use a null grid shift file for switching from your spherical lat/long coordinates to WGS84.

cs2cs +proj=latlong +datum=WGS84 +to +proj=merc +a=6378137 +b=6378137 +lat_ts=0.0 +lon_0=0.0 +x_0=0.0 +y_0=0 +k=1.0 +units=m +nadgrids=@null +no_defs

Note the strategic addition of +nadgrids=@null to the spherical projection definition"


As you can see the value of Open Source and the mailing list and Open Source software is that people are sharing knowledge - whether it be via blogs, lists, or some other means of communication. There is a community out there that supports each other. These are actual users facing everyday problems and looking for solutions. The answers do exist, just the question has to be asked, and the community comes together to help.

Thursday, October 11, 2007

Is WGS84 really WGS84? Is it correctly defined?


While doing some research on things that geodesists like - questioning MSL and the geoid, questioning how exact our definitions of ellipsoids and the earth are, I stumbled upon a very interesting article, written by Muneendra Kumar, PhD (Retired, National GeoSpatial Intelligence Agency) and James P Reilly, PhD (New Mexico State University) and they were asking:


Is definition of WGS 84 correct?


The following is written by these two distinguished gentlemen and I hope it proves to be as interesting to everyone as it was to me.


In the end, though, for most mapping purposes, WGS84 is still WGS84 and your latitude and longitude, or your Northing and Easting will remain the same.


As a side note, the North Pole is moving south and Sea Level is not level!


More on that little bit of geodesy in a later blog.


Enjoy and feel free to write me if you have any questions or comments.


Is Definition of WGS84 Correct?

by

MUNEENDRA
KUMAR, PHD AND JAMES P REILLY, PHD


A Geodetic Analysis

The first and original version of the "WGS 84", defined by a special committee of the Defense Mapping Agency (DMA), was released in September 1987.


As this task of updating the WGS 72 was concurrent with development of the North
American Datum (NAD) 1983, the committee members always had many in-depth
discussions with the members of the special committee of the National Geodetic
Survey (NGS). This approach ensured the; correct geodetic definition both for
WGS 84 and NAD 83. Around 1992, it was decided by DMA that, in future update(s)
of the "WGS 84" for accuracy enhancement, the academia and other satellite
geodesy experts would be associated. However, that scientific participation was
not followed and three subsequent updates were carried out without in-depth
discussions of satellite geodetic theory and/or correct statistical evaluation.
The non-scientific procedure(s) allowed definition deficiencies to creep in.
This paper outlines the geodetic details of the three updated versions of 1994,
1996, and 2001 and brings out in "open" the definition deficiencies in the
current version WGS 84 (G1150), which otherwise will remain hidden within the
National Geospatial- Intelligence Agency (NGA).The correctly defined "WGS 84",
the coordinate system used in GPS, is a critical requirement for the geodetic
integrity and accurate GPS positioning.


1984 "Original" Definition


The WGS 84 was originally defined with BIH Conventional Terrestrial System (CTS) for Reference Epoch "RE (84.0)". The main satellite data sets used were from the
Navy Navigation satellite System (NNSS). At the time of release in 1987, the
accuracy achieved was in the order of ± 1 - 2 meter and as such the tidal
effects, as specified in the International Association of Geodesy (IAG)
Resolution 16 of 1983 were not considered.


The "Three" WGS 84 Updates


1994 "WGS 84 (G730)"


This version was updated with the International Earth Rotation Service(IERS) realized International Terrestrial Reference Frame (ITRF) 19921, RE (88.0). During this update, NGA moved the RE (88.0) of the defining
ITRF to RE (94.0), which is incorrect. For this "change", DMA geodesists did not
have the capability and expertise. And, they did not have the authority to
override IERS. Note: With a new origin and orientation of its three axes, WGS 84
(G730) is geodetically a different coordinate system than the original WGS 84.
For mapping, the two could be considered the same. 1 First six ITRF solutions,
viz., ITRF 1988, ITRF 1989, ITRF 1990, ITRF 1991, ITRF 1992, and ITRF 1993, were realized for the RE (88.0). As the ITRF 1993 was based on all the data sets
available up to the end of year 1993 and thus realized in 1994, it would not
have been possible for DMA to define the WGS 84 (G730), which was realized using
the GPS data for the week starting 2 January 1994.


1996 "WGS 84 (G873)"


At the time of this update, the ITRF 1994, RE (93.0) was used (Note: ITRF96 (93.0) was not available). But, DMA geodesists again incorrectly moved the epoch of the
defining "RF" to RE (97.0). And, for geodetic application, they created the
third WGS 84. In addition, ignoring IAG Resolution No. 16 of 1983 and bypassing
IERS Conventions (IERS, 96), which recommend the "Zero-tide" model, National
Imagery and Mapping Agency (NIMA) geodesists adopted an "arbitrary" practice to
use "Tide-free" model. Note: According to IERS, the positions in the "Tide-free"
environ are non-realistic and not observable.


2001 Current "WGS 84 (G1150)"


During the updating of this version, the ITRF00, RE (97.0) was used.
But, like the 1994 and 1996 versions, NIMA geodesists incorrectly moved the RE
of the defining RF from (97.0) to (01.0), They also kept the 1996 practice for
"Tide-free" model, even after being alerted that the world's eminent geodesists
support the "Zerotide" of the IAG' standing Resolution No. 16 of 1983.
Furthermore, during the adjustment of the GPS tracking stations network, about
65% stations were held fixed (Note: An objection by the first author was not
even discussed). This over constrained adjustment is statistically incorrect and
not acceptable. Note: For geodetic positioning, this is the fourth version of
WGS 84.


The "Version" Identifiers


The "G730", "G873", and "G1150" indicate the GPS-week, of which the data sets were used to realize the three updates. As these "identifiers" do NOT specifically identify any definite time epoch, they do NOT have any geodetic significance.


Important "Contrast" To Note In SIRGAS 2000, the "RE" of the defining ITRF has NOT been "moved".


Analytical Conclusion


The current "WGS 84 (G1150)" is incorrectly defined, does not
comply with IAG Resolution No. 16 of 1983, and its time epoch is not definitive.
Furthermore, the adjustment of the GPS tracking station network is statistically
incorrect.


Reference


IERS, 96 IERS Conventions, Tech Note 21, July 1996.

Tuesday, October 9, 2007

Shapefiles and PRJ - Tying them together

ESRI has developed a de-facto standard for Shapefiles, but sometimes we as users' of Shapefiles forget something, a Shapefile is actually a minimum of three files.

The three mandatory/required files are:
  • .shp - the file that stores the feature geometry.
  • .shx - the file that stores the index of the feature geometry.
  • .dbf - the dBASE file that stores the attribute information of features.

A recent thread on the GDAL Mailing List led to the first link about Shapefiles. The key to the thread was a discussion about where Projections are stored in the Shapefile definition. As it can be seen, there is no location in the required files for projections.

Therefore ESRI adopted a new file type (PRJ) with the extension .prj.

So how are projections defined in this file?

As we know coordinate systems in terms of mapping can either geographic (longitude, latitude) or projected (X, Y). In the PRJ definition, the coordinate system is composed of several objects, with every object having a keyword in uppercase. Objects can be composed of other objects. ESRI calls the string in this file a Projection Engine (PE). The Sole purpose of the Projection Engine is to store the metadata for a coordinate system in a string, or in a .prj file. This string, which ESRI also calls a PE (not for Physical Education!) string, must be continuous and not broken.

Now the scary part: You can define your own units, datums, and spheroids!

An example, taken from the ESRI website, shows how we can define in .prj file a projected or geographic definition.

As we know projected coordinate systems (of which maps are) are based upon a geographic coordinate system (latitude, longitude), so the in their sample file, a projected coordinate system first is defined.

For example, UTM zone 10N on the NAD83 datum is defined as

PROJCS["NAD_1983_UTM_Zone_10N",
,
PROJECTION["Transverse_Mercator"],
PARAMETER["False_Easting",500000.0],
PARAMETER["False_Northing",0.0],
PARAMETER["Central_Meridian",-123.0],
PARAMETER["Scale_Factor",0.9996],
PARAMETER["Latitude_of_Origin",0.0],
UNIT["Meter",1.0]]

The geographic coordinate system name is followed by the datum, the prime meridian, and the angular unit of measure.

The geographic coordinate system string for UTM zone 10N on NAD 1983 is:

GEOGCS["GCS_North_American_1983",
DATUM["D_North_American_1983",
SPHEROID["GRS_1980",6378137,298.257222101]],
PRIMEM["Greenwich",0],
UNIT["Degree",0.0174532925199433]]

The full string representation of NAD 1983 UTM zone 10N is:

PROJCS["NAD_1983_UTM_Zone_10N",
GEOGCS["GCS_North_American_1983",
DATUM["D_North_American_1983",
SPHEROID["GRS_1980",6378137,298.257222101]],
PRIMEM["Greenwich",0],
UNIT["Degree",0.0174532925199433]],
PROJECTION["Transverse_Mercator"],
PARAMETER["False_Easting",500000.0],
PARAMETER["False_Northing",0.0],
PARAMETER["Central_Meridian",-123.0],
PARAMETER["Scale_Factor",0.9996],
PARAMETER["Latitude_of_Origin",0.0],
UNIT["Meter",1.0]]

As I stated earlier, you can define your own to use the predefined names for map projection and parameter object's.

I hope the above information aids in your understanding of Shapefiles and how projections and coordinate systems are defined.

My best advice for dealing with PRJ files; copy one that you already have and use it as a base, then modify the parameters as you need.

Good luck and have fun!

Monday, October 8, 2007

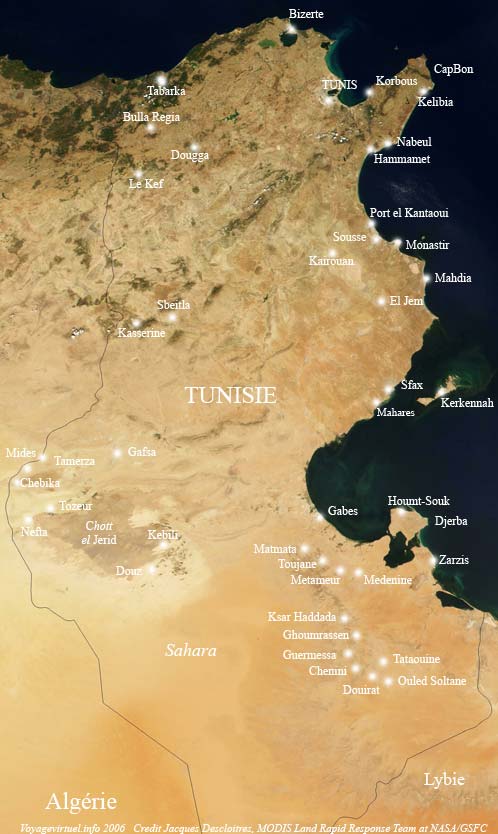
GeoTunis 2007 - November 15-17, 2007 - Tunis Science City


GeoTunis is occurring between 15th and 17th, November 2007 at the Tunis Science City in Tunisia.


As the website states: 'The task being an equal knowledge development and a stronger control of the digital information and telecommunications technologies with the purpose to decrease the digital gap between peoples. This symposium makes real the resolutions taken during the first national conference on map production "Geotunis 2006" and takes place in the same time with the International group world day celebration on the geographic information systems.'

OSGeo is hoping to be there as well, and information on OSGeo's participation can be found at here. This group is looking at promoting OSGeo and the Open Source Philosophy as it applies to Geospatial. They are also hoping to establish a stronger Francophone/French Speaking chapter that will include many French speaking nations.

I worked in Tunisia several years back with Schlumberger, involved with the Finder Data Management software and Tunisia's State Owned Oil Company - ETAP.

It is a beautiful country with great people and great food. The "Thé à la Menthe" and the "Chorba" are incredible.

With any luck, I'll make it to GeoTunis and be able to meet some new and old friends!


Sunday, October 7, 2007

cs2cs & BeTA2007 - Open Source, Germany & NTv2

Recently in the PROJ.4 Mailing List there was a discussion about working with the DHDN / Gauss Krueger to WGS84 conversion.

One of the posters listed a site and document that covered BeTA2007 (which means Bundeseinheitliche Transformation fur ATKIS) and allowed me to brush up on my German.

In reviewing the document, we find out that the method of Operation for the datum conversion is based on NTv2 and the coordinate reference system is ETRS89/UTM.

Within the document listed above, they even demonstrate how to do a coordinate coversion using cs2cs and how to use the +nadgrids parameter.

An example from the document shows that the +nadgrids does not have to be specific to North America, only that the data file containing the grid has the same format. This format has been specified by the Canadian Government and has been adopted by many countries (such as South Africa and Australia, to name a few).

This is the published example, using the BETA2007.gsb file and a data file containing these two points:

(1) 2490000.00 5652000.00
(2) 2504000.00 5628000.00


>> cs2cs \
+proj=tmerc +lat_0=0 +lon_0=6 +k=1.0000000 \
+x_0=2500000 +y_0=0 +ellps=bessel +units=m \
+nadgrids=./BETA2007.gsb
+to \
+proj=utm +ellps=GRS80 +zone=32

Resulting in:

2490000.00 5652000.00 <-- Input (1)
279488.01 5654871.71 0.00 <-- UTM 32/GRS80 Answer for (1)

2504000.00 5628000.00 <-- Input (2)
292503.36 5630318.18 0.00 <-- UTM 32/GRS80 Answer for (1)

So cs2cs works with other grid systems as long as they are defined the same as the NTv2 standard.

So all the above makes more sense, let me define, from Wikipedia, what ETRF is: "The European Terrestrial Reference System 1989, usually referred to as ETRS89, is a three-dimensional geodetic frame of reference - a mapping coordinate system used as the standard high accuracy system for GPS in Europe. It coincided with the World Geodetic System 1984 in 1989, hence the name, and is based on the same GRS80 ellipsoid. Unlike WGS84 or ITRS it is centred on Europe and diverges from them with the movements of the tectonic plates associated with this landmass."

Please see: http://en.wikipedia.org/wiki/ETRS89 for ETRS89 and http://en.wikipedia.org/wiki/World_Geodetic_System_1984 for WGS84

The parameters for a datum shift (dx, dy, dz, rx, ry, rz, etc.) between ETRS89 and WGS84 are not constant, due to the movement of the Eurasian geophysical plate with respect to WGS84. The differences between both datums can grow by several centimetres a year. Currently they are a couple of decimetres in difference. For many applications, these differences are not relevant. Coordinates or positions in WGS84 have usually been obtained by GPS and this results in an accuracy at the level of several metres. However, satellite positioning techniques continuously improve in accuracy, also without using differential stations. So the differences between the datum's will grow. Note that many nations are using WGS84 to define boundaries nowadays - so WGS84 is relevant.

One poster from France, to the mailing list, replied that they solved the problem of moving plates by adding a date to the location, and they stated their method as follows:

"We have solved this problem with moving plates by adding a simple date with the coordinates of WGS84. That way you can always go back to the original position of that particular date in WGS84 (or any). The WGS84 datum (with date) will stay accurate for ever, since it is always possible to trace back where the plates were at that specific date.

latitude,
longitude,
(WGS84),
date"

There are always solutions and answers to questions out there. Just feel free to ask, whether it be to a mailing list or your local expert, people are always willing to help and pass on knowledge.

Saturday, October 6, 2007

MapBender 2.4.3 Released & Online Training - An Orchestra of Data & Maps


While at FOSS4G2007 here in Victoria, I had my first introduction to MapBender and Arnulf Christi. My introduction was through a workshop entitled "Mapbender, Orchestrating the Geodata Concert". It was indeed a concert. Through the design of the software, you can pull together an instrumental or a ballad of data and imagery with ease.


Looking for a very good description of this orchestra, led me to their website, where I quote "Mapbender is the software and portal site for geodata management of OGC OWS architectures. The software provides web technology for managing spatial data services implemented in PHP, JavaScript and XML. It provides a data model and interfaces for displaying, navigating and querying OGC compliant map services. The Mapbender framework furthermore provides authentication and authorization services, OWS proxy functionality, management interfaces for user, group and service administration in WebGIS projects."

With Arnulf's planning and a strong understanding of MapBender, the workshop was a success, as we were Guinea Pigs for their online course. I do recommend to everyone new to MapBender.
I'm still finding out what software is out there in the OSGeo world, but MapBender ranks very high on my list of tools I want to keep in my toolbox.
The Press Release found on OSGeo states that minor changes were made, bugs fixes completed, a move to Trac (to keep track of changes), and Wiki to keep the project Human(e and) Readable. This is a key point, because sometimes reading code can be very inhumane (I know from experience!).
A full fledge training course (Online, I must add again!), can be found here.
I strongly encourage everyone to look at this project and delve into the training course, then look at adding MapBender to your list of tools that will allow you to build your Orchestra of Data & Maps from Services Worldwide.

Tuesday, October 2, 2007

EPSG Definitions and Searches Online


The EPSG has been around for what seems forever and the codes and definitions have made their way into Open Source GeoSpatial and Commercial software.


One difficulty has been the way many packages have implemented the database. Schlumberger converted the tables into CSV files for lookup with their initial implementation, then they adopted Mentor Software's approach and Mentor's C++ libraries. Different people see the data outside of the traditional MS Access approach and most often turn to some database that is not owned by Bill Gates! I think Larry Ellison was happy about this. EPSG realising this, then started releasing the data and data model in many different RDBMS formats (SQL scripts to create the tables and populate the database).


They released Version 6.14 on 2 September 2007.


There are various software providers and oil service companies that have taken the SQL and have produced web-sites that allow users to query the EPSG dataset in many different ways.


Three very useful sites are:


Developed by Petrosys for the oil and gas industry.


Developed by Howard Butler and Christopher Schmidt. They had a very simple aim: "hopes assist others in their understanding, recording, and usage of spatial reference systems". And they are succeeding. The site provides various formats for the codes to implement into web-mapping and software development.


This EPSG viewer was developed by Concept Systems Ltd., division of ION Geophysical Corporation. ION was previously known as Input/Output (I/O) and on September 21, 2007 they changed their name to better represent their services.


Have fun with these sites, and if you have any questions about the EPSG database, do not hesitate to contact me at the Terra ETL Website, under About Us.